The GREENest range-change map of all: Southern Masked Weaver 2013-03-21 (344)

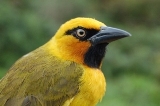
This is the GREENest range change map of all. It belongs to the Southern Masked Weaver. There are 1143 quarter degree grid cells where the reporting rates for SABAP2 exceed that of SABAP1 – these are the cells which are coloured GREEN on this map. In addition there are 60 BLUE cells – these represent cells where the species was not recorded during SABAP1, but where the species has been recorded during SABAP2.
 The colonization of the winter-rainfall area of the Western Cape took place half a century ago, well before SABAP1 in the 1980s. So if there had been a SABAP0, the range change map between SABAP0 and SABAP1 would have shown lots of BLUE, especially in the south. But in the past two decades, between SABAP1 and SABAP2, rather little range expansion has taken place. There are hints of movement into the last major gap in its distribution, southern KwaZulu-Natal and into the eastern end of the Eastern Cape, and there is also apparently some consolidation into Namaqualand in the Northern Cape. The colonization of the winter-rainfall area of the Western Cape took place half a century ago, well before SABAP1 in the 1980s. So if there had been a SABAP0, the range change map between SABAP0 and SABAP1 would have shown lots of BLUE, especially in the south. But in the past two decades, between SABAP1 and SABAP2, rather little range expansion has taken place. There are hints of movement into the last major gap in its distribution, southern KwaZulu-Natal and into the eastern end of the Eastern Cape, and there is also apparently some consolidation into Namaqualand in the Northern Cape.
 Much of the initial increase in range, and also the increase in reporting rates in the past two decades, appear to be fuelled by the provision of water and the breeding sites. It has been able to expand into arid and treeless areas through the proliferation of small dams on farms, with trees and reeds along the margins, and the construction of other artificial wetlands such as sewage works. In many rural towns and villages in open landscapes, water features and tree-planting in suburban gardens have helped this species. Even barbed wire fences provide nest building opportunities, especially in treeless grassland habitats, as shown in the picture, which was taken in the Free State near Harrismith. This is Record 1 in PHOWN, the Virtual Museum that assembles PHOtos of Weaver Nests. Much of the initial increase in range, and also the increase in reporting rates in the past two decades, appear to be fuelled by the provision of water and the breeding sites. It has been able to expand into arid and treeless areas through the proliferation of small dams on farms, with trees and reeds along the margins, and the construction of other artificial wetlands such as sewage works. In many rural towns and villages in open landscapes, water features and tree-planting in suburban gardens have helped this species. Even barbed wire fences provide nest building opportunities, especially in treeless grassland habitats, as shown in the picture, which was taken in the Free State near Harrismith. This is Record 1 in PHOWN, the Virtual Museum that assembles PHOtos of Weaver Nests.
The lower map shows the western Free State, and shows the actual reporting rates in quarter degree grid cells, with the SABAP1 value at the top and the SABAP2 value at the bottom. In many grid cells, the magnitude of the increase is impressive.
It does not appear to be displacing other weaver species. For example, in the Western Cape, where the range-change map for the Cape Weaver, which held the weaver monopoly until a few decades ago, is also mostly GREEN, with increased reporting rates. In fact, in general terms, all the weavers in the atlas region are doing pretty well, especially the granivorous species. The modifications to the environment are mostly having a positive impact on them.
Source: Les Underhill
|



 The colonization of the winter-rainfall area of the Western Cape took place half a century ago, well before SABAP1 in the 1980s. So if there had been a SABAP0, the range change map between SABAP0 and SABAP1 would have shown lots of BLUE, especially in the south. But in the past two decades, between SABAP1 and SABAP2, rather little range expansion has taken place. There are hints of movement into the last major gap in its distribution, southern KwaZulu-Natal and into the eastern end of the Eastern Cape, and there is also apparently some consolidation into Namaqualand in the Northern Cape.
 Much of the initial increase in range, and also the increase in reporting rates in the past two decades, appear to be fuelled by the provision of water and the breeding sites. It has been able to expand into arid and treeless areas through the proliferation of small dams on farms, with trees and reeds along the margins, and the construction of other artificial wetlands such as sewage works. In many rural towns and villages in open landscapes, water features and tree-planting in suburban gardens have helped this species. Even barbed wire fences provide nest building opportunities, especially in treeless grassland habitats, as shown in the picture, which was taken in the Free State near Harrismith. This is