Weaver Wednesday 3: range changes in S Africa
(species text)
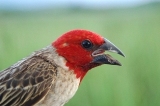
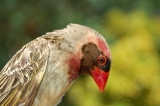
Southern Red Bishop Euplectes orix
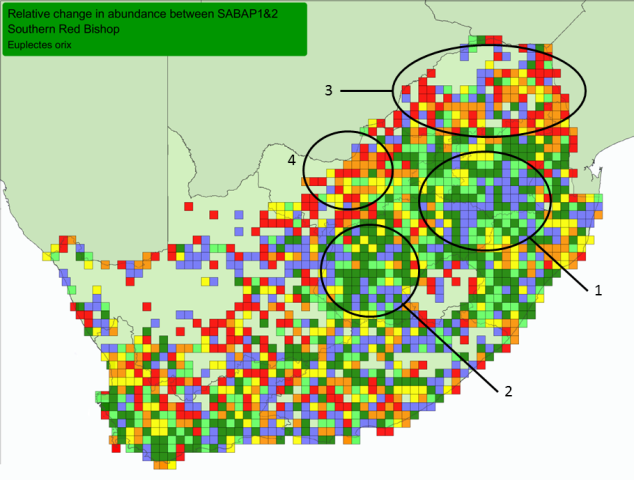
Southern Red Bishop, Range-change map between SABAP1 (1987-1991) and SABAP2 (2007-current).
Red, orange and yellow = cells with very large, large, and small relative decreases
Blue, dark green and light green = cells with very large, large and small relative increases.
Cells = quarter-degree grid cells; Only cells with at least 4 checklists in both SABAP1&2 shown. All cells had this species recorded in SABAP1 or in SABAP2 or in both (more about interpretation at Biodiversity Observations 7.62: 1-13).
Southern Red Bishop, figure from Birdpix
Range changes in SA
Range change summary
More
4 lists
30 lists
increases
n
%
n
%
Decrease
431
29
144
23
Tiny change
427
29
215
36
Increase
642
43
253
41
Total
1500
100
612
100
In South Africa the Southern Red Bishop has more grid cells with increases in reporting rate than cells showing decreases, between SABAP1 (1987-1991) and SABAP2 (2007-).
The points below match the points on the map above.
Areas with very large increases include:
1. Gauteng, north-eastern Free State, and southern Mpumalanga.
2. Central and southern Free State.
Areas with very large decreases include:
3. Most of Limpopo Province.
4. Central North-west Province.
Many areas in South Africa show a checkered pattern, suggesting small changes (ie stable populations).
Range changes elsewhere
Exotic populations established in foreign countries, eg United Arab Emirates, Australia: Appendix of Dyer EE, Redding DW, Blackburn TM. 2017. The global avian invasions atlas, a database of alien bird distributions worldwide. Nature Scientific Data 4 no: 170041.