Weaver Wednesday 3: range changes in S Africa
(species text)
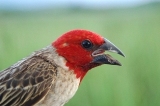
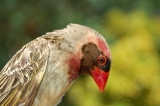
Red-billed Quelea Quelea quelea
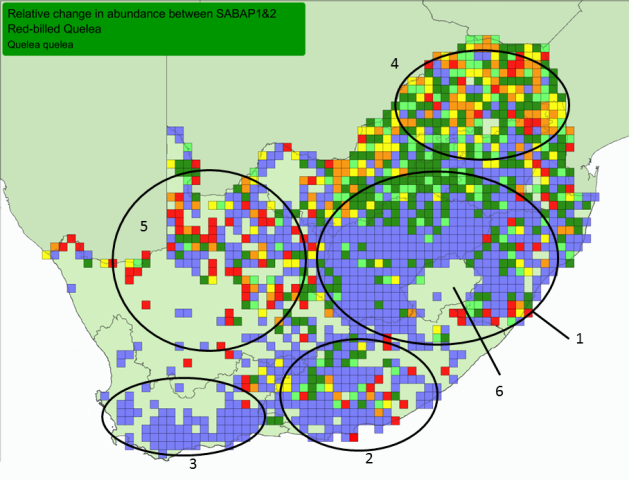
Red-billed Quelea, Range-change map between SABAP1 (1987-1991) and SABAP2 (2007-current).
Red, orange and yellow = cells with very large, large, and small relative decreases
Blue, dark green and light green = cells with very large, large and small relative increases.
Cells = quarter-degree grid cells; Only cells with at least 4 checklists in both SABAP1&2 shown. All cells had this species recorded in SABAP1 or in SABAP2 or in both (more about interpretation at Biodiversity Observations 7.62: 1-13).
Red-billed Quelea, figure from Birdpix
Range changes in SA
Range change summary
More
4 lists
30 lists
increases
n
%
n
%
Decrease
200
15
51
9
Tiny change
221
16
102
20
Increase
929
69
372
71
Total
1350
100
525
100
In South Africa the Red-billed Quelea has many more grid cells with increases in reporting rate than cells showing decreases, between SABAP1 (1987-1991) and SABAP2 (2007-).
The points below match the points on the map above.
Areas with very large increases include:
1. Free State to southern KwaZulu-Natal.
2. Western part of the Eastern Cape.
3. Most of the Western Cape - this is a range expansion in recent decades.
Mixed results (increases and decreases):
4. Limpopo Province
5. North-West Province and the Northern Cape - mixed results due to poor coverage - more atlasing needed!
6. Lesotho - occurs at low density; SABAP2 coverage too low for meaningful results.
Range changes elsewhere
Exotic populations established in foreign countries, eg Spain, Oman, Reunion: Appendix of Dyer EE, Redding DW, Blackburn TM. 2017. The global avian invasions atlas, a database of alien bird distributions worldwide. Nature Scientific Data 4 no: 170041.