Weaver Wednesday 3: range changes in S Africa
(species text)
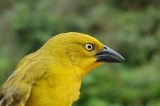
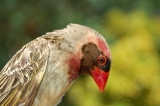
Cape Weaver Ploceus capensis
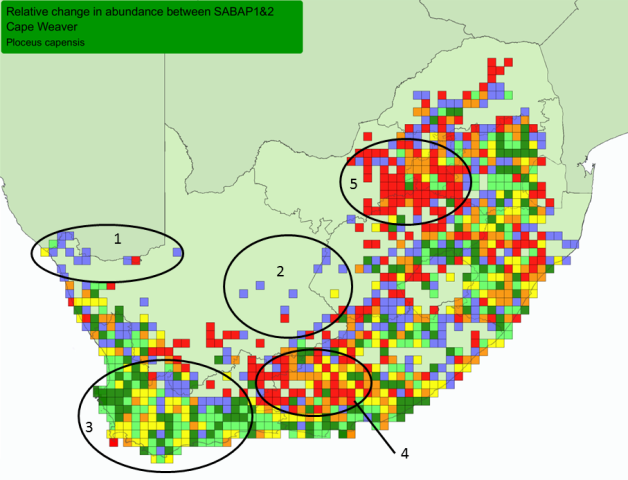
Cape Weaver, Range-change map between SABAP1 (1987-1991) and SABAP2 (2007-current).
Red, orange and yellow = cells with very large, large, and small relative decreases
Blue, dark green and light green = cells with very large, large and small relative increases.
Cells = quarter-degree grid cells; Only cells with at least 4 checklists in both SABAP1&2 shown. All cells had this species recorded in SABAP1 or in SABAP2 or in both (more about interpretation at Biodiversity Observations 7.62: 1-13).
Cape Weaver, figure from Birdpix
Range changes in SA
Range change summary
More
4 lists
30 lists
increases
n
%
n
%
Decrease
366
35
165
33
Tiny change
298
29
172
35
Increase
364
36
163
32
Total
1028
100
500
100
In South Africa the Cape Weaver has about the same number of grid cells with increases, as cells with decreases, in reporting rate, between SABAP1 (1987-1991) and SABAP2 (2007-).
The points below match the points on the map above.
Areas with very large increases include:
1. Lower Orange River in the Northern Cape.
2. Central parts of the Northern Cape and western Free State - new range records at scattered localities.
Areas with mixed changes:
3. Western Cape - this is the core part of the range for the Cape Weaver, with some grids showing large increases, but most grids showing small changes (either increases or decreases).
Areas with very large decreases:
4. Border of the Western Cape and Eastern Cape.
5. Gauteng - the Cape Weaver occurs here at a low reporting rate.
Range changes elsewhere
Namibia: breeding records on the Namibian side of the Orange River (Oschadleus 2016z3).