Weaver Wednesday 3: range changes in S Africa
(species text)
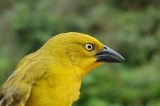
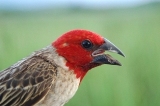
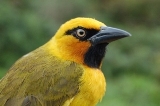
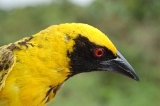
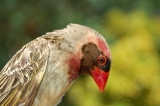
Red-headed Weaver Anaplectes rubriceps
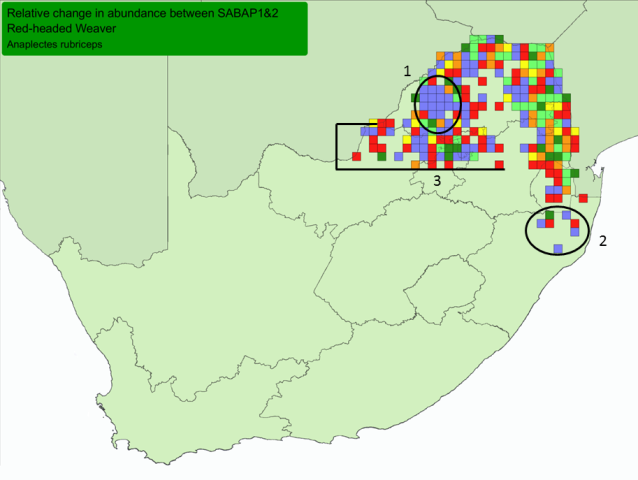
Red-headed Weaver, Range-change map between SABAP1 (1987-1991) and SABAP2 (2007-current).
Red, orange and yellow = cells with very large, large, and small relative decreases
Blue, dark green and light green = cells with very large, large and small relative increases.
Cells = quarter-degree grid cells; Only cells with at least 4 checklists in both SABAP1&2 shown. All cells had this species recorded in SABAP1 or in SABAP2 or in both (more about interpretation at Biodiversity Observations 7.62: 1-13).
Red-headed Weaver, figure from Birdpix
Range changes in SA
Range change summary
More
4 lists
30 lists
increases
n
%
n
%
Decrease
90
41
47
38
Tiny change
36
16
30
24
Increase
95
43
45
37
Total
221
100
122
100
In South Africa the Red-headed Weaver has more grid cells with increases in reporting rate than cells showing decreases, between SABAP1 (1987-1991) and SABAP2 (2007-).
The points below match the points on the map above.
Areas with very large increases include:
1. Western Limpopo Province.
Vagrant records:
2. Zululand, KwaZulu-Natal - new vagrant records show as blue grids, and vagrant records from SABAP1 are red.
Density:
3. It occurs at low density between 24 and 26 S.
Range changes elsewhere
Guinea: Pinselli Forest Reserve, range extension (Demey 2012b).
Kenya: Changoto woodlands near Dakatcha, range extension (Demey 2011a).