Weaver Wednesday 3: range changes in S Africa
(species text)
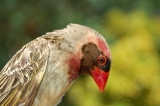
Dark-backed Weaver Ploceus bicolor
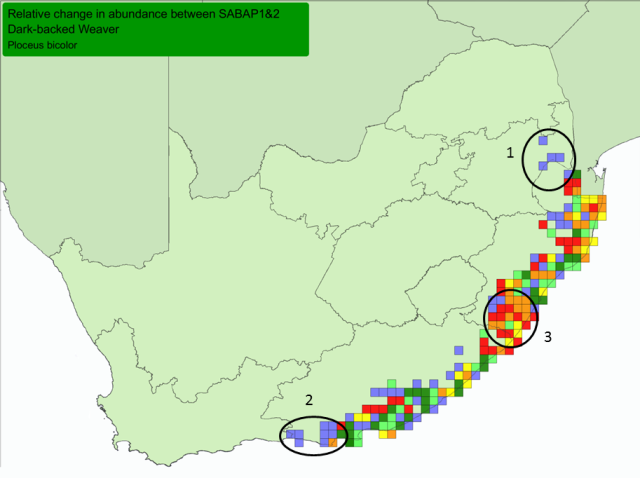
Dark-backed Weaver, Range-change map between SABAP1 (1987-1991) and SABAP2 (2007-current).
Red, orange and yellow = cells with very large, large, and small relative decreases
Blue, dark green and light green = cells with very large, large and small relative increases.
Cells = quarter-degree grid cells; Only cells with at least 4 checklists in both SABAP1&2 shown. All cells had this species recorded in SABAP1 or in SABAP2 or in both (more about interpretation at Biodiversity Observations 7.62: 1-13).
Dark-backed Weaver, figure from Birdpix
Range changes in SA
Range change summary
More
4 lists
30 lists
increases
n
%
n
%
Decrease
64
34
35
27
Tiny change
50
27
38
29
Increase
77
41
57
44
Total
191
102
130
100
In South Africa the Dark-backed Weaver has more grid cells with increases in reporting rate than cells showing decreases, between SABAP1 (1987-1991) and SABAP2 (2007-), although this is reversed when using 30 checklists for the analysis. The Dark-backed Weaver is still regular in many areas but habitat loss and fragmentation of natural forest may affect the overall population of this species.
The points below match the points on the map above.
Areas with very large increases include:
1. range expansion at northern end of its South African range, i.e. in Mpumalanga
2. range expansion at southern end of its range, i.e. around the Eastern Cape/Western Cape border
Large decreases appear to have occurred:
3. low reporting rate and shows decreases in southern KwaZulul-Natal.
Range changes elsewhere
Uganda: 3 seen, first record at Mt Elgon for 100 years (Demey 2011b).
Zimbabwe: range expansion upstream along Zambesi River (Rushforth 2003a).
Zimbabwe: range expansion - Lake Manyame, Harare (Baker 2009a).